Learning from the Past - Data Visualizations That Changed History
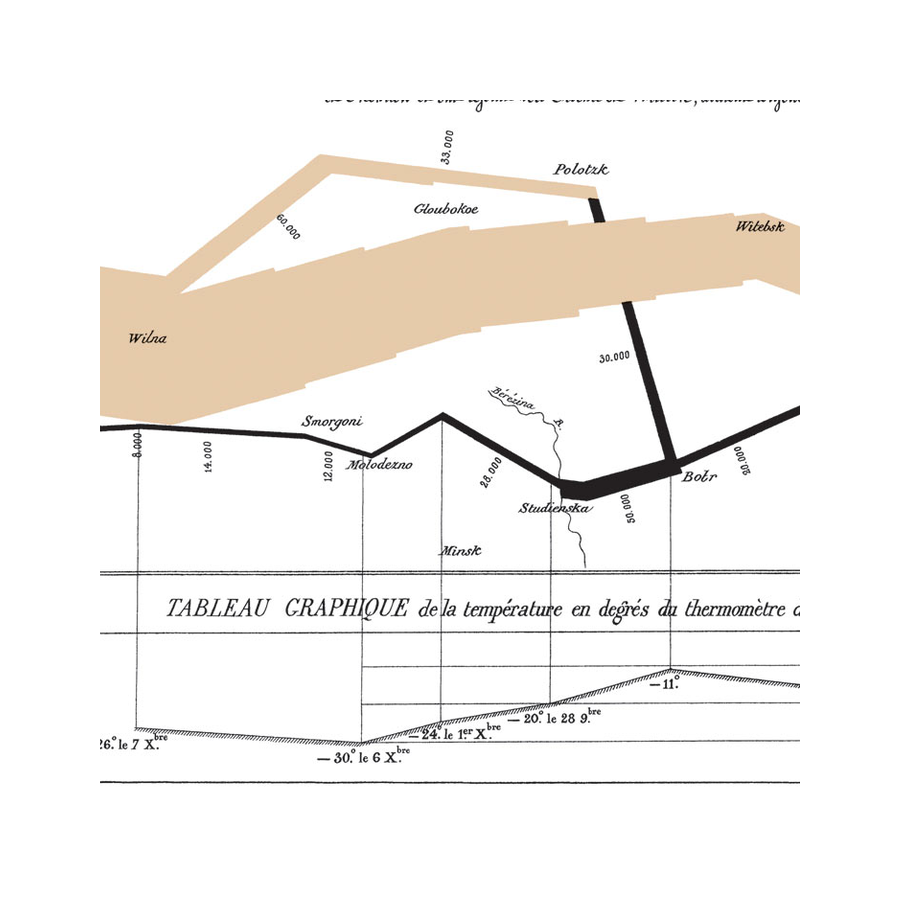
From John Snows cholera map, through the Nightingale military mortality Rose Charts to Minard’s March to Moscow, history is replete with amazing examples of data visualization that we can take lessons from and apply to our work today.
This course guides participants through a number of history changing visualizations and the group will break down the key elements of each one to come up with a list of best practices, concepts and approaches that can be applied in the environment today using new tools and techniques.
Category:
Data Visualization
Product Code:
DV-8
Course Duration (hours):
8
