
All training courses are provided in-house and the courses listed below can be mixed to meet your needs.
Please contact us to discuss what courses would best match your requirements and if you have any questions on specific courses or course categories.

This lab is designed for participants to cement their data visualization skills and to develop competencies. In a collaborative environment, participants can bring along their own data set or use an example data set provided by Data Action Lab. Visualizations will be created and constructively criticized by all attendees.
This lab is software tool agnostic, typically attendees create visualizations in Excel, Power BI, SAS, R, Python or any other tool of their choice.
Poorly designed visualizations (graphs, reports, charts, slides etc.) can lead to confusion and in the worst case erroneous business decisions. End users are constantly seeking the best ways to understand the data behind the data. The most effective way to help end users is by making it visual for them. This module is aimed at taking participants through the basics of data visualization and design whether you are creating Power BI interactive reports, generating charts in Excel or management presentations in PowerPoint. This module will help you to:
- Effectively engage with the end users to properly define reporting context
- Understand the importance of narrative and storyboarding as part of the design process
- Understand what design elements engage inconic, short and long term memory
- Matching visualizations to data, including best practices and implementation hacks (Excel and Power BI) for:
- Interactive text, Data tables, Data table heatmaps, Scatterplots and bubble plots, Line charts, Bar Charts (Vertical & Horizontal), Stacked Bar Charts (Vertical & Horizontal), 100% Bar Charts (Vertical & Horizontal), Area Charts, Waterfall Charts, Treemaps, Funnel Charts, Key Performance Indicator Gauges, Data Geographical Maps and Choropleth Maps
- Charts and visualizations to avoid
- Fully understand the basic rules of Design and Layout including:
- Gestalt Principles, Pre-attentive Attributes, Decluttering your charts, dashboards and reports, Size and positioning, Basic colour rules and introduction to colour wheel calculations
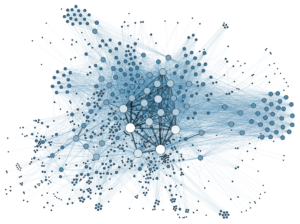
Data visualizations can be used for reporting endeavours in a variety of manners, but they can also be used to explore data and set the stage for more in-depth analysis, and for insight extraction. In this module, participants will
- Learn about the different roles of data visualization in the data analysis process.
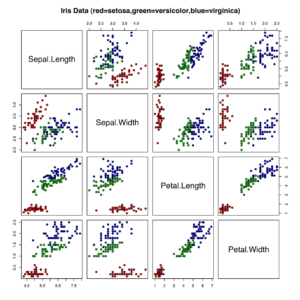
- Increase their understanding of how to represent simultaneously multiple dimensions.
- Learn some of the strategies and considerations used to create good post-analysis visualizations.
- Learn the difference between a visualization and an infographic.
- Improve their judgment about the quality of data visualizations.
In particular, participants will study the use of data visualizations for
- Detecting anomalous and invalid entries
- Shaping data transformations
- Getting a sense for the data
- Identifying hidden data structure
They will also study the fundamental principles of analytical design and learn how to recognize their application in a number of case studies, Finally, they will study the grammar of graphics.
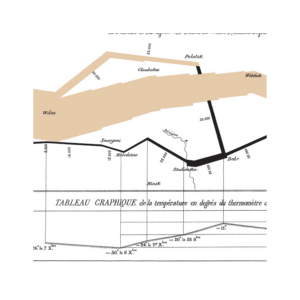
From John Snows cholera map, through the Nightingale military mortality Rose Charts to Minard’s March to Moscow, history is replete with amazing examples of data visualization that we can take lessons from and apply to our work today.
This course guides participants through a number of history changing visualizations and the group will break down the key elements of each one to come up with a list of best practices, concepts and approaches that can be applied in the environment today using new tools and techniques.